
StatsWales Help
Introduction
StatsWales is the Welsh Government’s free-to-use online repository for detailed statistical data for Wales. StatsWales allows users to view and manipulate datasets on-screen, including the ability to produce charts. Data can be downloaded in a variety of formats and can be saved and shared. The system covers nearly 1,000 datasets, including key information on Wales’ population, economy, government spending and performance as well as the environment, education, transport and health.
Locating Data
There are 2 ways to find data:
1 Browsing the catalogue
Tables and charts are organised into statistical themes and are found by browsing through the catalogue structure on the left-hand side of the page. Tables and charts appear in the window on the right-hand side under the ‘Reports’ heading. Click the title of the report to view it.
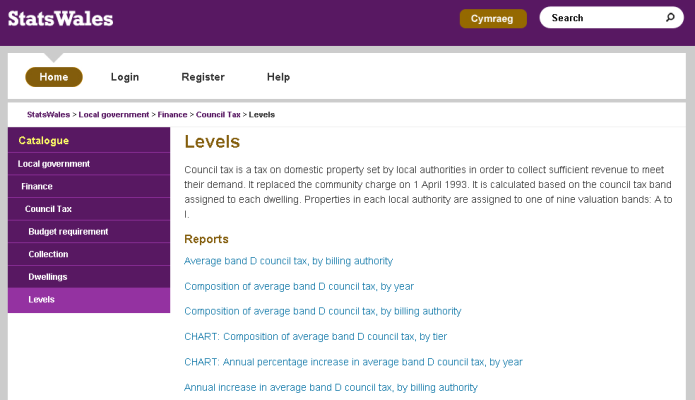
2 Searching
If you are not sure where to find the data you need then there is a search facility at the top of the webpage. Enter your search term and click the magnifying glass icon. A list of reports and other documents relating to your search will appear. Click on the title of the report to view the data.
Organising Data
Once you’ve clicked on a report, you’ll be presented with a table of data organised in a predetermined way, this is normally just a high level view of a larger data set which you can explore through a few different methods:
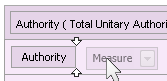
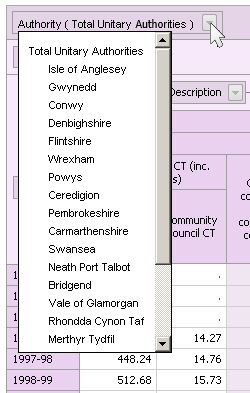
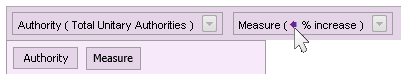
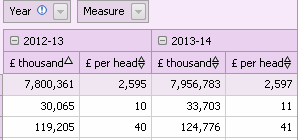
Selecting data
The drop-down boxes within the body of the table allow you to choose which items will appear in your table. The drop-down box displays an expandable list of the available data items which can be ticked or un-ticked.
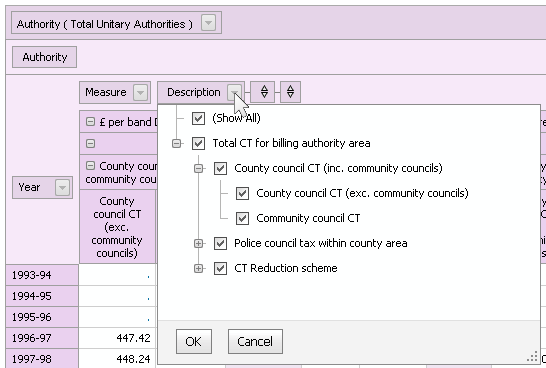
Tip: The size of the drop-down box can be changed by dragging the bottom right-hand corner.
Expand & Collapse
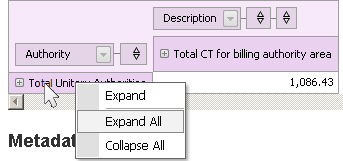
Any items appearing in the tables with either a ‘+’ or ‘-‘ sign can be expanded or collapsed respectively. This allows you to explore the underlying data of individual data items. If you wish to expand or collapse all the items in the table then click the text next to the ‘+’ or ‘-‘ sign using the right mouse button. This brings up another menu that allows you to expand or collapse all the items at once.
Drag & Drop
The elements of the table can be dragged and dropped either to the left or to the top of the table to create the view of the data that you need. Drag the elements within the table until 2 small arrows appear and then drop them in the appropriate place in the table. To remove an element from the table, drag the element into the filter bar directly above the table.
Tip: Look for the 2 small arrows before dropping
Nesting elements together
A table can have a number of elements nested together either on the left hand side or at the top of the table. Drag the element and drop it next to the element that is already within the body of the table and the elements will be displayed alongside each other. In order to view the data once elements have been nested, it is sometimes necessary to expand the items within the table using the techniques described above.
Filter bar
The filter bar is located directly above the table and can contain a number of elements. Only one item for each element is selectable and the data in the table will change once selected. These elements can be used to derive the data within the table or they can be dragged into the body of the table. Similarly, elements that you don’t want to show within the body of the table can be dragged up into the filter bar.
Some elements display left and right arrows which allow you to change items easily.
Tip: When dragging and dropping elements to and from the filter bar, make sure you drag the elements just below the drop down boxes.
Sorting data
The data within the table can be organised by sorting on the item labels or data values. Triangles appear on each level of the elements of the table allowing you to sort the data.
If you click on the triangles on the row or column descriptions then the data within the tables will be sorted by the items labels.
You can also right-click the elements and a menu appears that also allows the table to be sorted using the item labels.
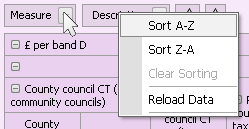
If you click the triangles on the column headers then the data within the table will be sorted in either ascending or descending order within any subtotals that may be displayed.
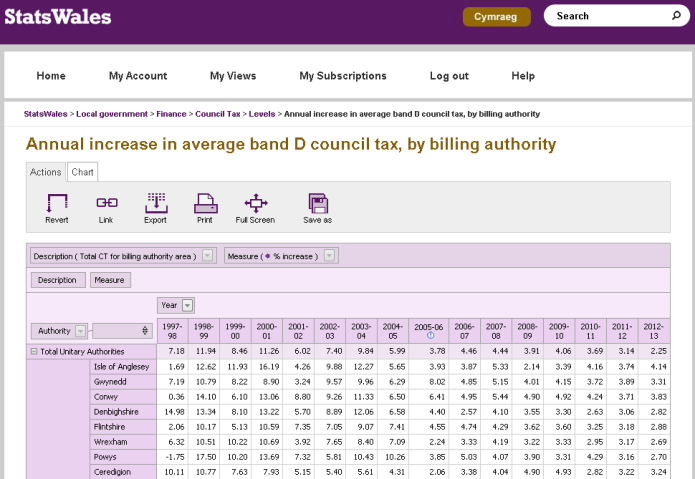
Data Toolbar
The data toolbar appears automatically above each table.
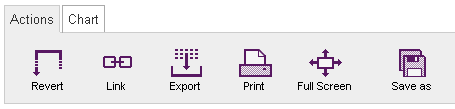
Revert
Returns you to the original view of the data before any changes were made.
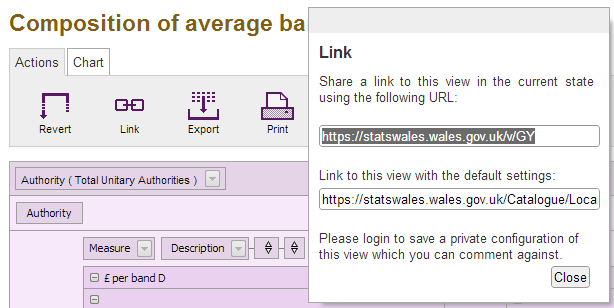
Link
Creates a temporary hyperlink to the current view of the data that is shown on-screen. This link can be added to your bookmarks/favourites so you can return to it at any time or it can be shared with others. If you wish to create a more permanent view of the data then you can register your details on the website and save your reports to your own private area using the ‘Save as’ button which is described later.
Tip: Temporary hyperlinks can be shared but private views cannot.
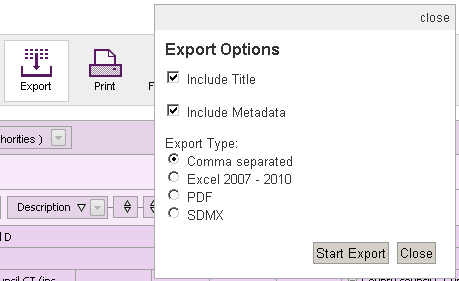
Export
The viewable data can be downloaded into a number of other formats such as comma-separated values, Microsoft Excel. The data can be exported including the title of the report and associated metadata by ticking the appropriate check boxes.
The current view of the data will be shown in a separate, printable tab within the web browser. Sometimes your web browser will prompt you to allow pop-ups in order to see the printable tab.
Full Screen mode
Makes the most of your screen size and resolution by removing banners and utilising the whole width of your screen.
Once you have registered to use the site and you have logged in, you are able to save your views in your own private area including your own description of the view.
Charting Toolbar
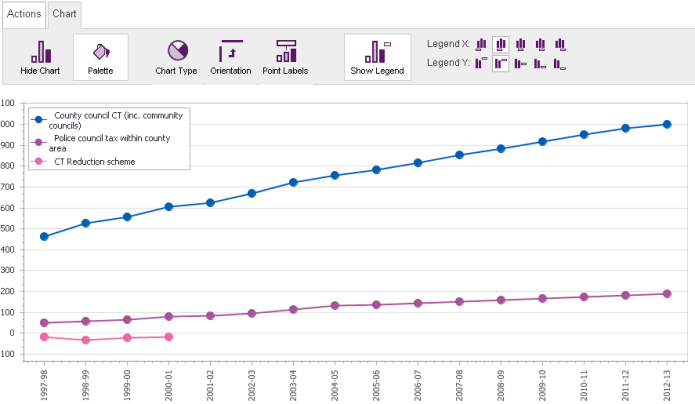
Show/Hide Chart
Display a chart of the data that is currently displayed. The chart will appear above the table of data within the web page. If a chart is already displayed, it can be removed by clicking the icon again.
Palette
Changes the colours used in the chart between blue and multicoloured palettes.
Chart Type
Select from a range of 10 different chart types to suit your needs.
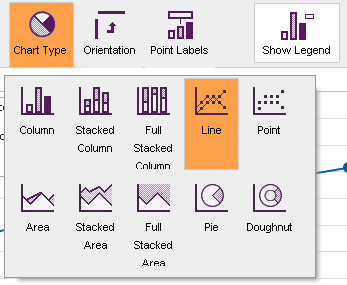
Tip: The best charts are created by keeping the table simple.
Orientation
Sometimes the chart might not appear as you’d intended. The ‘orientation’ button will simply swap the axes of the chart and display an alternative chart.
Point Labels
Displays the actual data values at the relevant points within the chart.
Hide/Show Legend
Adds or removes the legend from the body of the chart.
Legend X
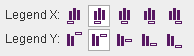
Moves the legend to 5 set positions on the chart from left to right. The legend can be placed outside the chart to the left or right or at 3 locations within the chart itself.
Legend Y
Moves the legend to 5 set positions on the chart from top to bottom. The legend can be placed outside the chart from top to bottom or at 3 locations within the chart itself.
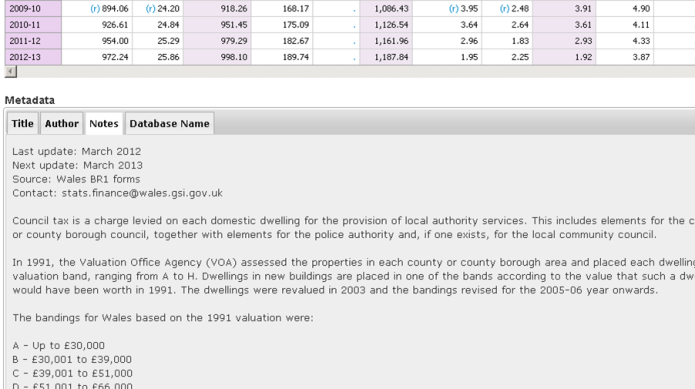
Metadata
Each data set will have any metadata associated with it listed at the bottom of the page. Tabs are used to locate different types of information such as the unique reference of the data set, the publishing date of any new data and contact details should you require any further information.
Personalisation
Once you have registered to use the site using the ‘Register’ button and logged in, you are presented with some additional options.
‘My Account’ allows you change your personal details such as username and email.
‘My views’ displays the views that you have saved in your own private area.
‘My subscriptions’ allows you to subscribe to a particular dataset alert. You will be notified by email when the relevant data set is updated. In order to subscribe to a data set, click on the envelope icon on the top right-hand corner of a page where links to reports appear.
StatsWales Open Data Guidance
Introduction
As described in this blog, the previous OData service ceased at the end of August 2024. It has been replaced by an interim Open Data service that makes the underlying data available in a similar format but is not available via an API.
The interim solution provides users with links to download similar data to that which was available via the previous OData service. The solution provides:
- A zip file containing a csv data file for the cube. This is similar to what was available from the ‘Dataset’
OData (eg
http://open.statswales.gov.wales/dataset/care0136). The format of the column headings will be different as the Welsh and English are both in the csv file with the English fields ending with _Eng and the Welsh with _Wel. Some of the fields/columns will have endings like _INT, _STR to denote the data type. For those users who use PowerBI and are bringing the data directly in, you can still do this with zip files. An example is given on the PowerBI support pages: How to unzip and decompress data extract URL in PBI Query Editor - Microsoft Fabric Community - A csv file with the dimension items. This was the equivalent of
http://open.statswales.gov.wales/engb/discover/datasetdimensionitems?$filter=Dataset eq 'care0136' - A csv file with the dimensions. This was the equivalent of
http://open.statswales.gov.wales/en-gb/discover/datasetdimensions?$filter=Dataset eq 'care0136' - An xml file with the cube metadata. This was the equivalent of
http://open.statswales.gov.wales/en-gb/discover/metadata?$filter=Dataset eq 'care0136’
Accessing Dataset URLs/Links
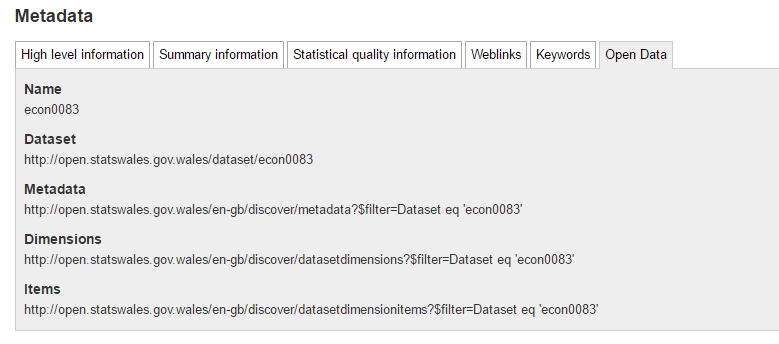
For ease of reference the dataset specific URLs are available under the ‘Open Data’ tab in the Metadata section at the bottom of each dataset view as shown.
Where possible, these URLs/links are preserved even when there has been an update to the datasets such as when statistical releases are updated.
Re-use Considerations
The innovative use of our data is encouraged and welcomed. As a re-user of our data you might find the following useful:
- All statistics made available on StatsWales follow the standards defined by the UK Statistics Authority, an independent body operating at arm’s length from government as a non-ministerial department. All data classed as Official Statistics are produced according to the principles of the Code of Practice for Statistics. Statistics that have been assessed as compliant with the code and approved by the UK Statistics Authority will also be designated as National Statistics.
- It is important when re-using data that you understand the data you plan to use. This not only relates to understanding the format and structure of the data but the limitations of the data itself. To help identify whether data is fit for the purpose for which you plan to use it we’ve documented limitations, where they exist, in the metadata (whether at a dataset, dimension or dimension item level). Therefore please refer to the relevant metadata prior to re-using our data.
- All data on StatsWales may be used and re-used (not including logos) free of charge in any format or medium, under the terms of the Open Government License (OGL). However in doing so you must acknowledge the sources of information and, where possible, provide a link to the license: http://www.nationalarchives.gov.uk/doc/open-government-licence/version/3/
- Whilst re-use of our data within interactive apps, websites, reports etc. is encouraged the use of our logo is restricted and may not be used by other individuals or organisations without formal permission from us. For more information please see Welsh Government logo: guidance | GOV.WALES
- We are of course interested to know who is using our data, how they plan to use it and any issues encountered. So if you have any questions or feedback please get in touch: Contacts for statistics | GOV.WALES
Data Structure
A summary of the fields returned by each file is explained below.